The Marketer's Guide to QR Campaign Tracking: One Campaign, Ten Locations
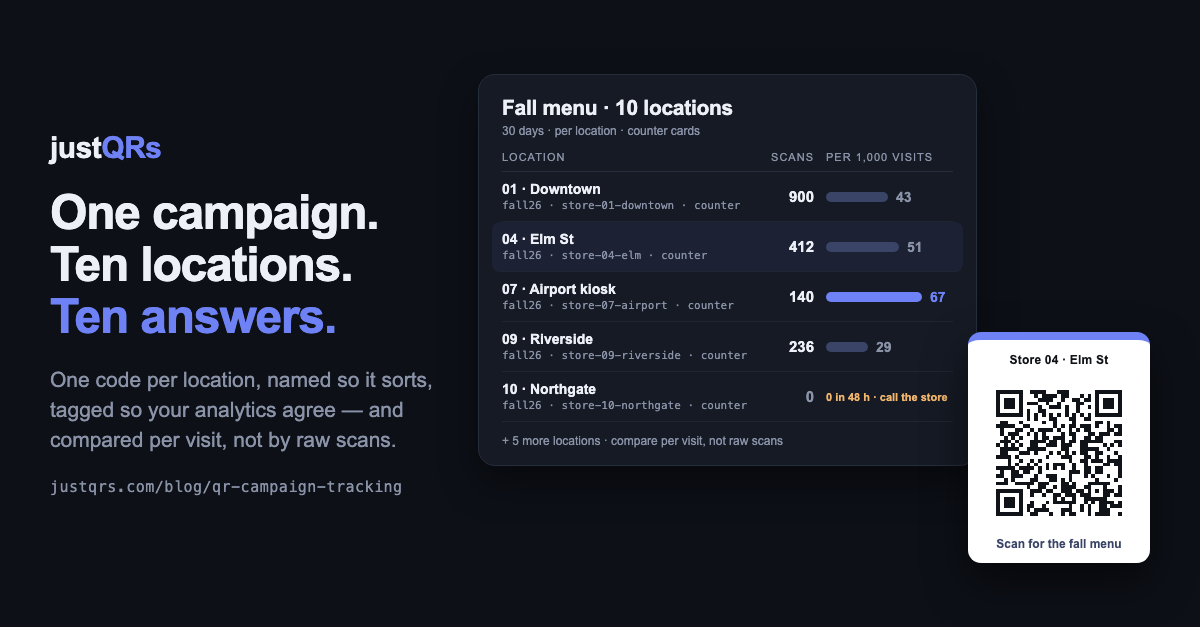
The poster went up in ten stores on the same Monday. Four weeks later the report says 3,140 scans, and your regional manager asks the only question that matters: which stores did it?
If every poster carries the same code, there is no answer. You have one number for ten locations, and the decision you actually need to make — where to put next quarter's budget, which store's setup to copy, which one never hung the poster — gets made on gut feel.
We covered the basics of scan analytics in our guide to tracking QR code scans. This one is about what changes when a campaign goes out to many locations at once: franchise and multi-store retail, restaurant groups, clinics and branches, an agency running one client's promotion across a region.
Why multi-location QR campaigns go dark
The failures are predictable, and almost all of them are decided before anything is printed:
- One code everywhere. Printing is simpler, so every location gets the same artwork. The result is a campaign total you can't break down.
- Codes nobody can identify. Forty codes named "QR 1" through "QR 40," or "Fall promo final v2." In a month, nobody remembers which one went to the airport store.
- Tags that don't line up. One person types
store4, anotherStore-04, a thirdelm-street. Your web analytics now shows three sources for one shop. - Raw totals compared across unequal stores. The flagship always "wins" on scans because it has ten times the foot traffic, not because its poster worked better.
- One location needs a change. A store closes for a refit, a franchisee runs a different offer, the landing page moves. With codes that point straight at a URL, that's a reprint.
Plan the grid before you print
Treat the campaign as a grid: locations down the side, placements across the top. Ten stores with a window poster and a counter card is a 10 × 2 grid — twenty codes. Each cell gets its own code, and the grid itself becomes your tracking plan.
Two rules keep the grid useful:
- Split by anything you'd move money between. Locations, almost always. Placements (window vs. counter vs. receipt) when you'd actually change the mix next time.
- Don't split past the point of meaning. One code per table, per shelf, or per register produces dozens of tiny numbers that never reach significance. A code that gets eight scans a month can't tell you anything. One code per location per placement is usually the right grain.
A naming convention that survives the campaign
Pick one pattern, write it down, and never type a name freehand:
campaign · location · placement — for example fall26 · store-04-elm · counter
- Lowercase, hyphens, no spaces inside a part. It sorts cleanly and survives spreadsheets.
- Use a fixed location ID, not just a nickname. Store numbers outlive store names, and a number sorts in order.
- Keep the plan in one spreadsheet — location ID, placement, code name, destination, date the material went up. That sheet is your import file, your printer's reference, and your key for reading the report later.
Tag destinations with the same words
Your QR platform counts scans; your web analytics counts what happens after. To make them agree, put UTM parameters on each code's destination URL — never in the printed code itself — using the same tokens as the name:
yoursite.com/fall?utm_campaign=fall26&utm_source=store-04-elm&utm_medium=qr&utm_content=counter
utm_campaignis the campaign, identical everywhere.utm_sourceis the location ID.utm_mediumisqrfor every code, so QR traffic is one filter away.utm_contentis the placement.
Now a scan report row and a web analytics row describe the same thing in the same words, and
nobody has to reconcile Store-04 with store4 at the quarterly review.
Decide what each location's code opens
Most campaigns send every location to one campaign page, and that's fine — the tags tell the stores apart. Two cases call for a per-location destination:
- The next step is local. If the scan should end in "book at this branch," "order from this store," or "see this location's hours," send it to that location's page.
- Locations diverge mid-campaign. One store's offer ends early or one franchisee runs a variation. With dynamic codes, change that location's destination and leave the other nine alone.
Either way, the page should be built for a phone and do one thing. A scan that lands on a homepage is a scan wasted.
Compare locations fairly
Ten locations means ten different audiences. A few habits keep the comparison honest:
- Divide by an opportunity measure. Scans per 1,000 visitors, per 1,000 transactions, or per day open. A flagship with 900 scans from 21,000 transactions is pulling about 43 per 1,000; an airport kiosk with 140 from 2,100 is pulling about 67. The kiosk's setup is the one to copy.
- Use unique scans to count people and total scans to measure use. A code scanned twice by the same phone is one interested customer.
- Align the windows. If materials went up on different days, compare each location from its own go-live date — that's why the go-live column is in the sheet.
- Treat a zero as a logistics problem first. A location with no scans after 48 hours almost never has a demand problem. The poster is still in the box, hung behind a display, or printed too small. Call the store before you change the offer.
- Visit the winner. When one location clearly outperforms per visit, go and look: placement height, staff mentioning it, a counter card by the payment terminal. That's the insight you roll out to the other nine.
Not everything needs tracking
If a location just needs a Wi-Fi card for the waiting room or a contact card at the front desk, make it a static code — it encodes the content directly, needs no paid plan, and never expires. Tracking is for the codes someone will be asked about at a review. If no one will ever look at the numbers, a static code is the honest choice.
The rollout checklist
- List every location and every placement; draw the grid.
- Merge cells that will never be big enough to matter.
- Name every code
campaign · location · placementfrom the sheet. - Put matching UTM tags on every destination URL.
- Decide which locations need their own destination page.
- Print a proof at final size; scan it with three phones, Wi-Fi off.
- Record each location's go-live date.
- At 48 hours, chase every location still at zero.
- At two and four weeks, compare per visit, not raw totals.
- Repoint underperforming destinations instead of reprinting.
Where justQRs fits
justQRs is built for this kind of campaign without enterprise pricing:
- Create the grid in one go. Bulk import turns a CSV — up to 100 rows per import — into named dynamic codes, so your planning sheet becomes the codes. The REST API does the same from your own tools.
- Per-code analytics on every code. Each code has lifetime scans, scans and daily uniques over 7, 30, or 90 days, and breakdowns by country, city, device, operating system, and browser. Your dashboard lists every code with its scan count. There's no built-in multi-code campaign report — for the side-by-side, the API pulls each code's stats into a spreadsheet, next to your visitor or transaction counts.
- Change one location without touching the rest. Each code's destination is editable after printing.
- One flat price. $9.99/month or $89/year covers 500 dynamic codes with unlimited scans and five team seats — enough for a 10 × 2 grid and many campaigns after it. Packs of 500 more codes or 5 more seats are self-serve from the billing page.
- If you stop paying, nothing is deleted. Static codes keep working; dynamic codes and their analytics stay stored and pause until you're back.
A free justQRs account designs and downloads static QR codes forever — no watermarks, no expiry. And if you want codes you can edit and track, every feature is free for 7 days, no card required.
Need a QR code? Generate a static code free — no account — or see what dynamic codes cost.